The direct creation visual form via acoustics or other wave phenomenon has several historical contexts. Ernest Chladni used plates of metal covered with sand, that he would vibrate using musical instruments. Chladni first demonstrated this at the French Academy of Science in 1808, it caused such interest that the Emperor offered a kilogram of gold to the first person who could explain the patterns. (Chladni was a meteorite enthusiast and had a large collection; he was one of the first recorded individuals to assert that meteorites feel from the sky.) The following is a drawing from Chladni's original publication.
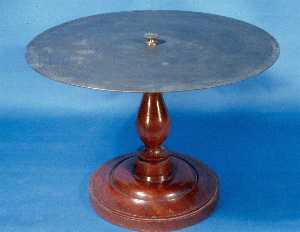
| An original Chladni plate, with graphic representation (exaggerated) of plate deformation in the presence of acoustic waves. |  |
 |
|
Vibration diagram at a particular mode An example of a plate vibrating in this mode  |
Another mode of vibration | and a diagram of that mode 
|  |
Ernest Chladni's original diagram of vibrational modes on flat plates
Chladni's work was part of the inspiration for Jules Antoine Lissajous' 1857 creation of a harmonograph, a pen-based device for drawing oscillatory patterns on paper. The harmonograph would later inspire the oscilloscope, a basic instrument of scientific research. In 1891 Margaret Watts Hughes created an 'eidophone' that allows vocal sounds to cause acoustic formation, leading to the rendition of voice, chanting and other music.
Harmonograph
In the 1950's Hans Jenny brought together under the banner of 'cymatics' a range of structural dynamics studies that covered vibratory phenomenon to the chemical and biological level. Jenny's thesis is that all life operated on harmonic principles. Throughout the cosmos we see various natures of form, even in the spiral motion of the vortex. Oscillating rhythms and other dynamics underly form at all scales, including life.
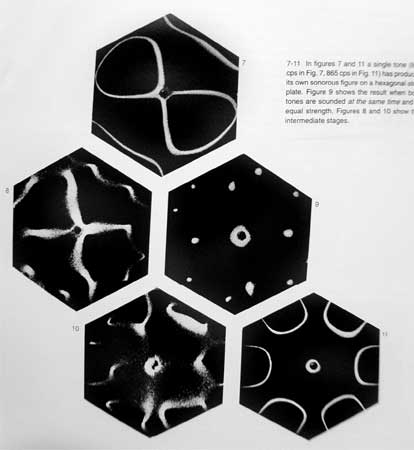 Dual frequency wave interaction. The top image is the acoustic node of one frequency (800Hz), the bottom-right is a different frequency (865Hz). The center-right image is the cymatics of both waves being induced simultaneously; the center-left and bottom left are the intermediary stages between these two frequencies (where the amplitude of each wave is different).
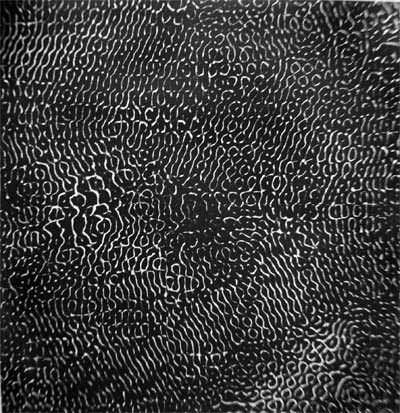
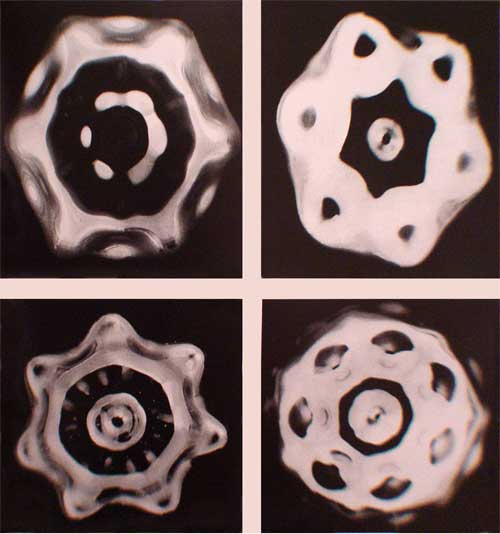
High frequency cymatics produces tightly-packed node structures
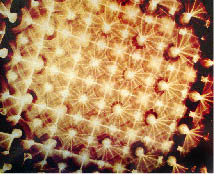
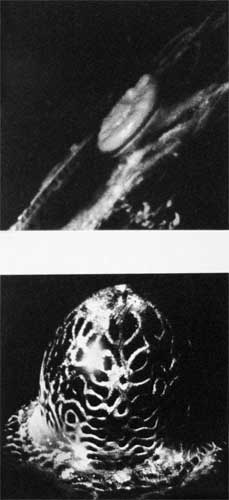
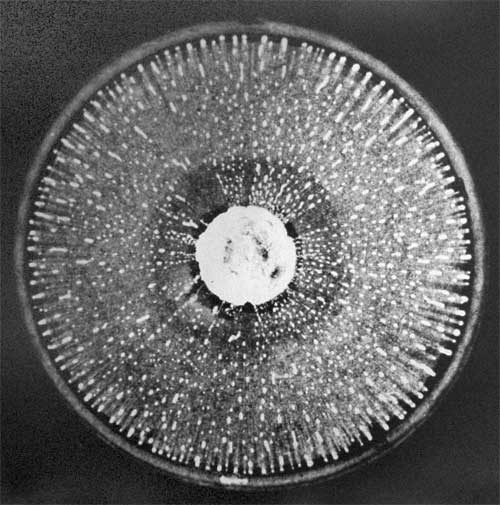
This image is an overhead shop of a funnel being vibrated at a given frequency. The white spots in it are of clumps of sand particles, which climb up the walls of the funnel under sufficient acoustic energy. If the energy is lowered the sands falls. An equilibrium can be reached in which the sand cycles up and down the walls.
The Cymatics of odd shapes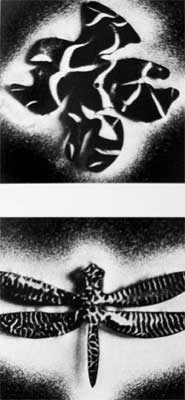 |
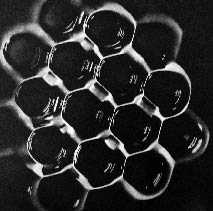
Cymatic forms on 3D objects |